Submission 2025-04-17
Hello Assembly
1. Use the GCC and Clang compilers to compile the function and generate assembly code.
gcc:
gcc -S hello_assembly.c -o hello_assembly.sclang:
clang -S hello_assembly.c -o hello_assembly_clang.s
2. In the generated assembly code generated by the two compilers:
gcc
Locate the string “Hello Assembly Language!”.
line 7
Identify the instructions that the compilers insert to conform to the procedure call standard.
stp x29, x30, [sp, -16]!mov x29, spldp x29, x30, [sp], 16
Identify the function call to libc that prints the string.
bl puts(branch link and puts)
 1  .arch armv8-a
 2  .file       "hello_assembly.c"
 3  .text
 4  .section    .rodata
 5  .align      3
 6.LC0:
 7  .string     "Hello Assembly Language!"
 8  .text
 9  .align      2
10  .global     hello_assembly
11  .type       hello_assembly, %function
12hello_assembly:
13.LFB0:
14  .cfi_startproc
15  stp x29, x30, [sp, -16]!
16  .cfi_def_cfa_offset 16
17  .cfi_offset 29, -16
18  .cfi_offset 30, -8
19  mov x29, sp
20  adrp        x0, .LC0
21  add x0, x0, :lo12:.LC0
22  bl  puts
23  nop
24  ldp x29, x30, [sp], 16
25  .cfi_restore 30
26  .cfi_restore 29
27  .cfi_def_cfa_offset 0
28  ret
29  .cfi_endproc
30.LFE0:
31  .size       hello_assembly, .-hello_assembly
32  .ident      "GCC: (GNU) 14.2.1 20250110 (Red Hat 14.2.1-7)"
33  .section    .note.GNU-stack,"",@progbits
clang
Locate the string “Hello Assembly Language!”.
line 31
Identify the instructions that the compilers insert to conform to the procedure call standard.
stp x29, x30, [sp, #-16]!mov x29, spldp x29, x30, [sp], #16
Identify the function call to libc that prints the string.
bl printfbranch link
 1  .text
 2  .file       "hello_assembly.c"
 3  .globl      hello_assembly                  // -- Begin function hello_assembly
 4  .p2align    2
 5  .type       hello_assembly,@function
 6hello_assembly:                         // @hello_assembly
 7  .cfi_startproc
 8// %bb.0:
 9  stp x29, x30, [sp, #-16]!           // 16-byte Folded Spill
10  .cfi_def_cfa_offset 16
11  mov x29, sp
12  .cfi_def_cfa w29, 16
13  .cfi_offset w30, -8
14  .cfi_offset w29, -16
15  adrp        x0, .L.str
16  add x0, x0, :lo12:.L.str
17  bl  printf
18  .cfi_def_cfa wsp, 16
19  ldp x29, x30, [sp], #16             // 16-byte Folded Reload
20  .cfi_def_cfa_offset 0
21  .cfi_restore w30
22  .cfi_restore w29
23  ret
24.Lfunc_end0:
25  .size       hello_assembly, .Lfunc_end0-hello_assembly
26  .cfi_endproc
27                                        // -- End function
28  .type       .L.str,@object                  // @.str
29  .section    .rodata.str1.1,"aMS",@progbits,1
30.L.str:
31  .asciz      "Hello Assembly Language!\n"
32  .size       .L.str, 26
33
34  .ident      "clang version 19.1.7 (Fedora 19.1.7-3.fc41)"
35  .section    ".note.GNU-stack","",@progbits
36  .addrsig
37  .addrsig_sym printf
3. Write a C++ driver that calls the hello_assembly function and test your implementation.
gcc -c hello_assembly.c -o hello_assembly.og++ -o hello_assembly.exe hello_assembly.cpp hello_assembly.o
Assembly Function
1. Assemble the file and use the name add_values.o for the output.
as add_values.s -o add_values.o
2. Generate the following from add_values.o:
Hexadecimal dump
od -A x -t x1 add_values.o > add_values.hex
Section Headers
readelf -S add_values.o > add_values.relf
Disassembly
objdump --syms -S -d add_values.o > add_values.dis
3. Find the size of the .text section in the generated output and explain it.
 1There are 7 section headers, starting at offset 0x130:
 2
 3Section Headers:
 4  [Nr] Name              Type             Address           Offset
 5      Size              EntSize          Flags  Link  Info  Align
 6  [ 0]                   NULL             0000000000000000  00000000
 7      0000000000000000  0000000000000000           0     0     0
 8  [ 1] .text             PROGBITS         0000000000000000  00000040
 9      0000000000000020  0000000000000000  AX       0     0     4
10  [ 2] .data             PROGBITS         0000000000000000  00000060
11      0000000000000000  0000000000000000  WA       0     0     1
12  [ 3] .bss              NOBITS           0000000000000000  00000060
13      0000000000000000  0000000000000000  WA       0     0     1
14  [ 4] .symtab           SYMTAB           0000000000000000  00000060
15      0000000000000090  0000000000000018           5     5     8
16  [ 5] .strtab           STRTAB           0000000000000000  000000f0
17      000000000000000f  0000000000000000           0     0     1
18  [ 6] .shstrtab         STRTAB           0000000000000000  000000ff
19      000000000000002c  0000000000000000           0     0     1
20Key to Flags:
21  W (write), A (allocate), X (execute), M (merge), S (strings), I (info),
22  L (link order), O (extra OS processing required), G (group), T (TLS),
23  C (compressed), x (unknown), o (OS specific), E (exclude),
24  D (mbind), p (processor specific)
Size of .text: 0x20 byte or equal 32 bytes. .text corresponds to the size of all instructions. The add_values.s file has 8 instructions in total, each is 4 byte long. Therefore, \(8 \cdot4\) byte \(=32\) byte \(=\) 0x20 byte.
4. Write a C++ driver that calls the add_values function and illustrate it with an example.
g++ -o add_values.exe add_values.cpp add_values.o
5. Use the GNU Project Debugger GDB to step through an example call to the add_values function. Display the contents of the general-purpose registers after each of the executed instructions.
Using GDB
gdb <executable>Inside GDB
lay next
press <Enter> to toggle the available views of GDB
Note
The current layer view will be fixed if an instruction is run. Use
lay nextto be able to toggle the views again.Use following commands to navigate:
break <label>adds a breakpoint at a specific label e.g. a function declaration
runstarts the program
nextmove to the next line in the C++ code
nextimove to the next line in the assembly Instruction
stepstep into a function call
refrefreshes the view
x/i $pcexamines the Instruction at the program counter
info registersshow the current register state of the program
quitexit GDB
g++ -o add_values.exe -g add_values.cpp add_values.oAdd debug information with-ggdb add_values.exelay nextPress <Enter> 3 times to get a view with assembly instruction and the registers.
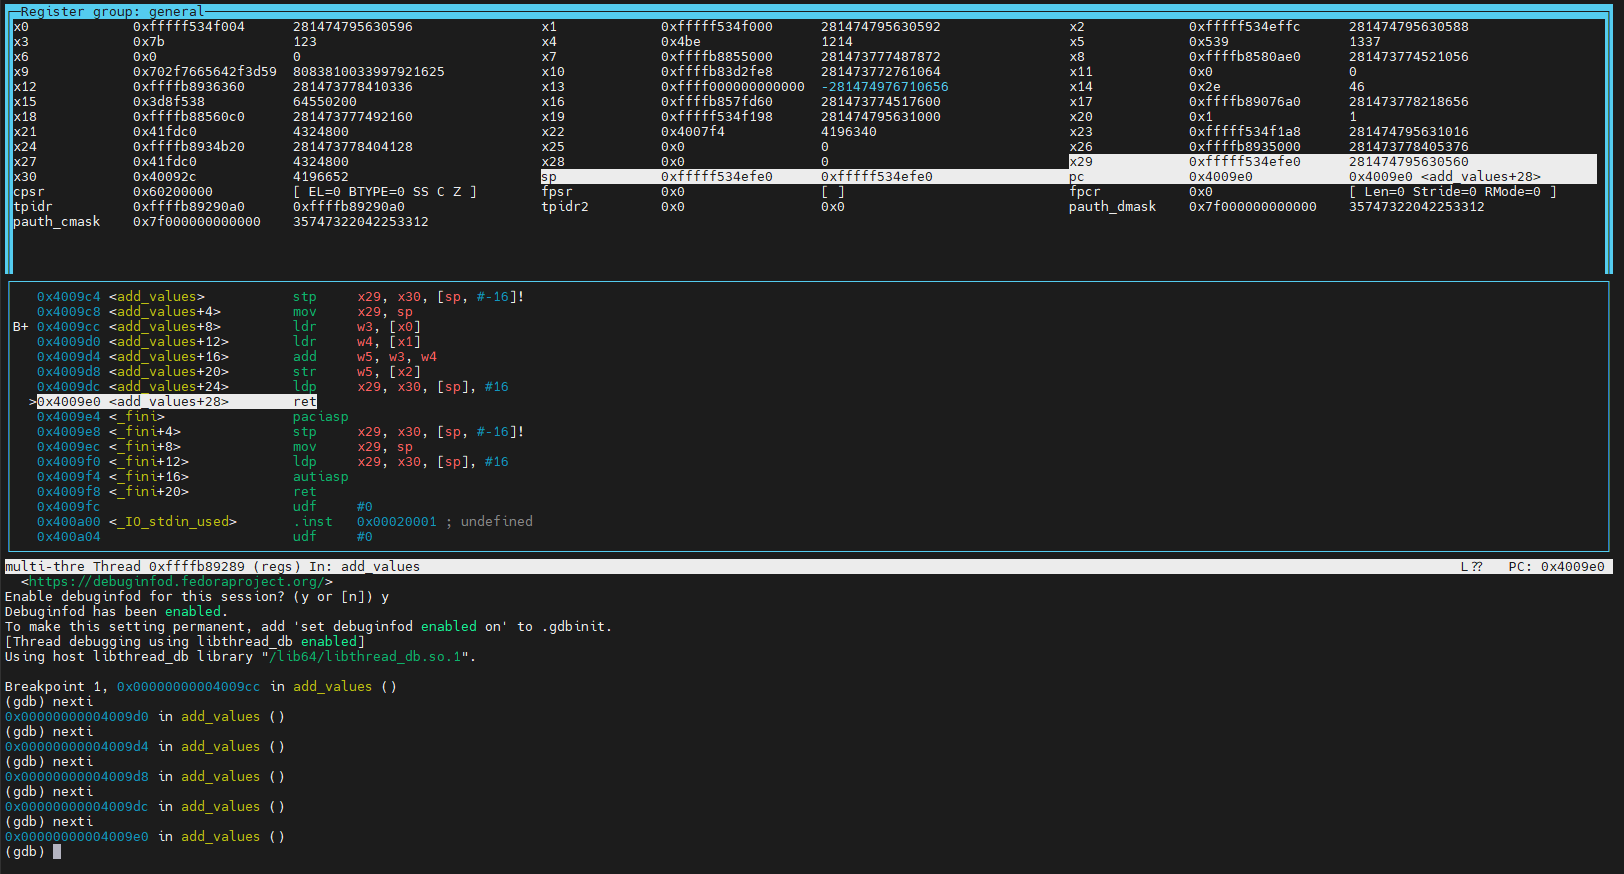
break add_valuesrun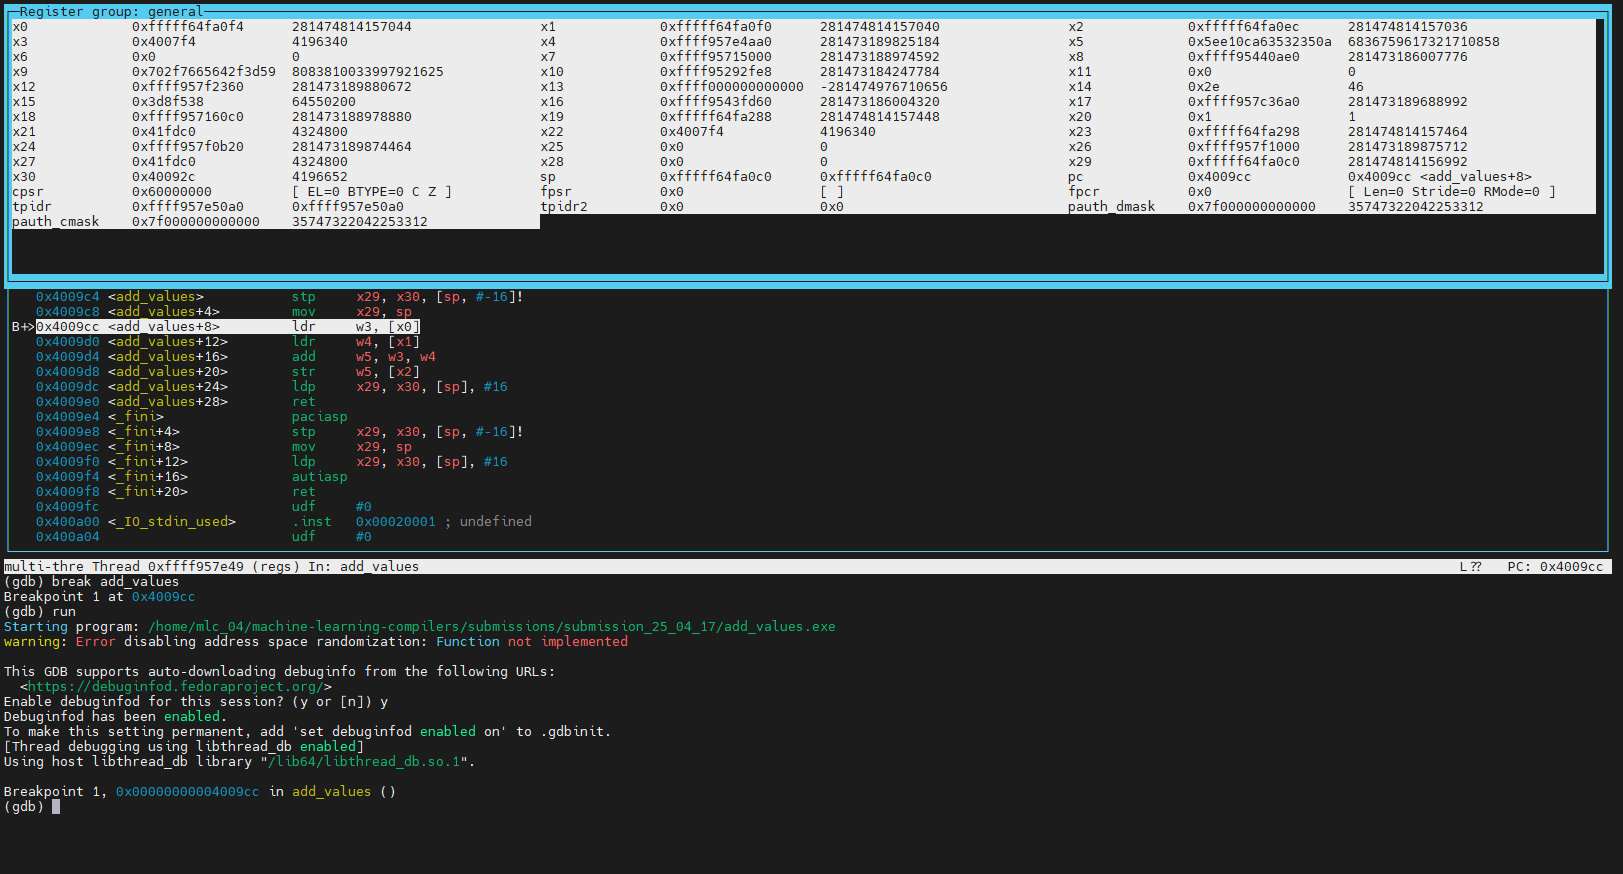
nexti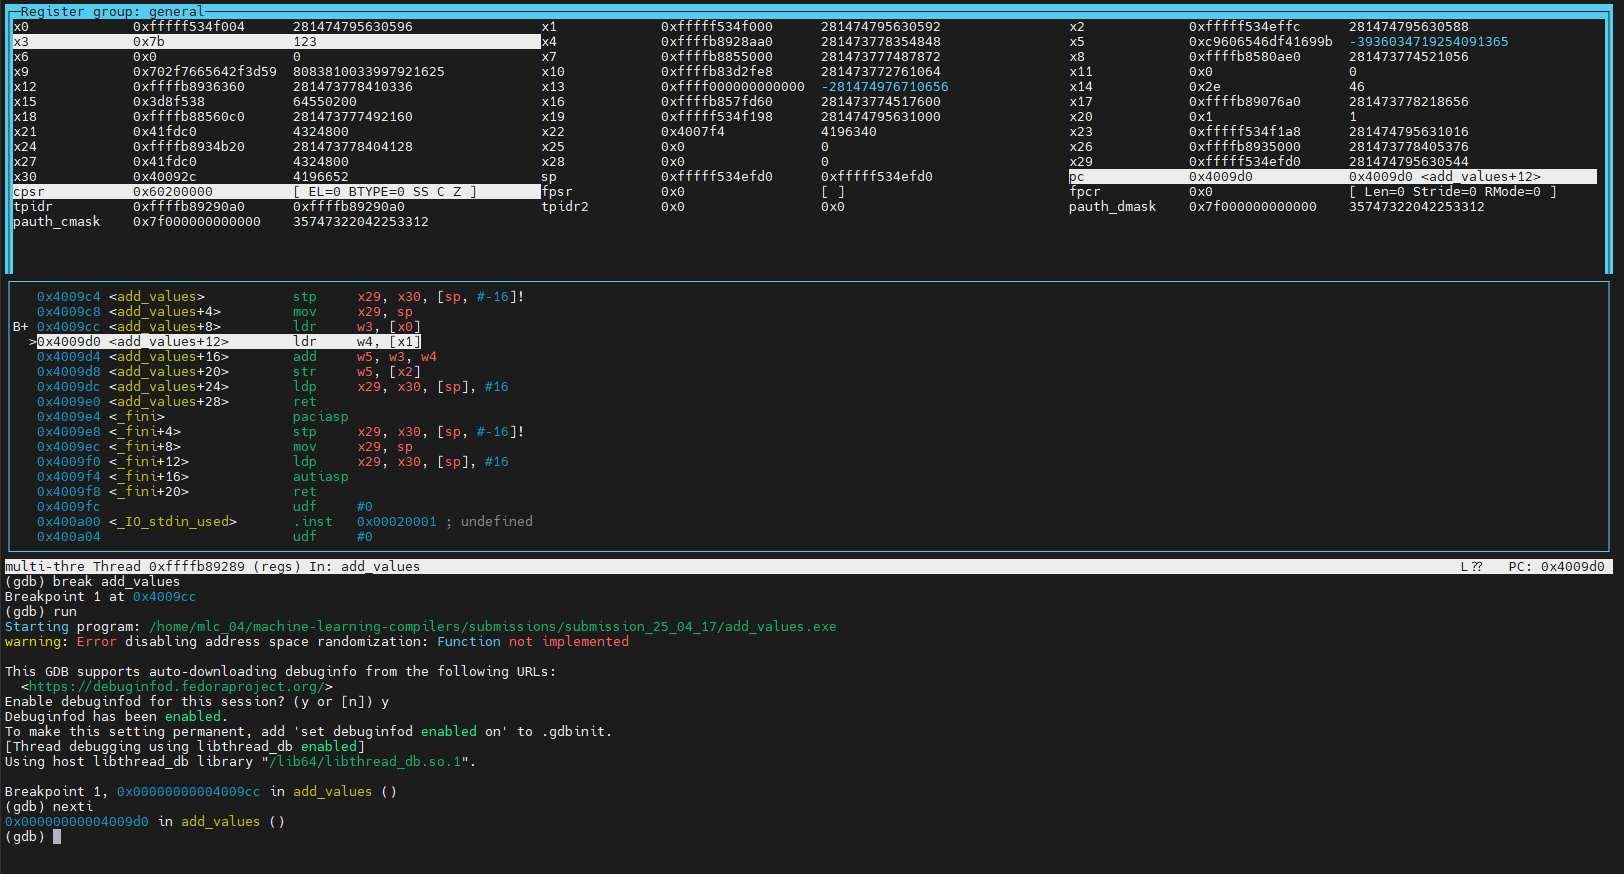
nexti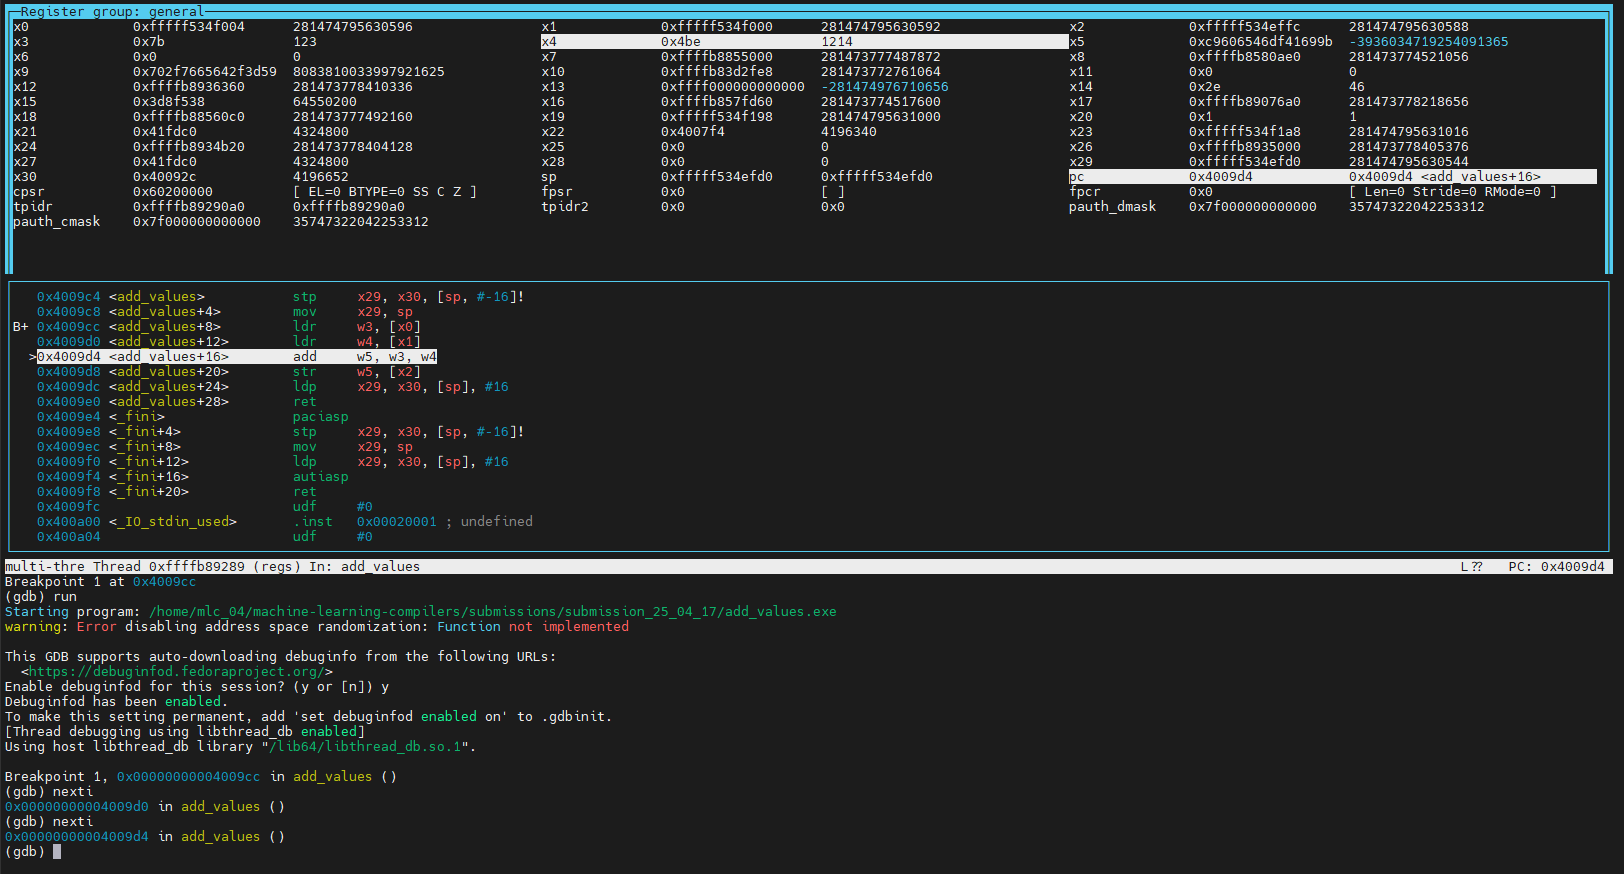
nexti
nexti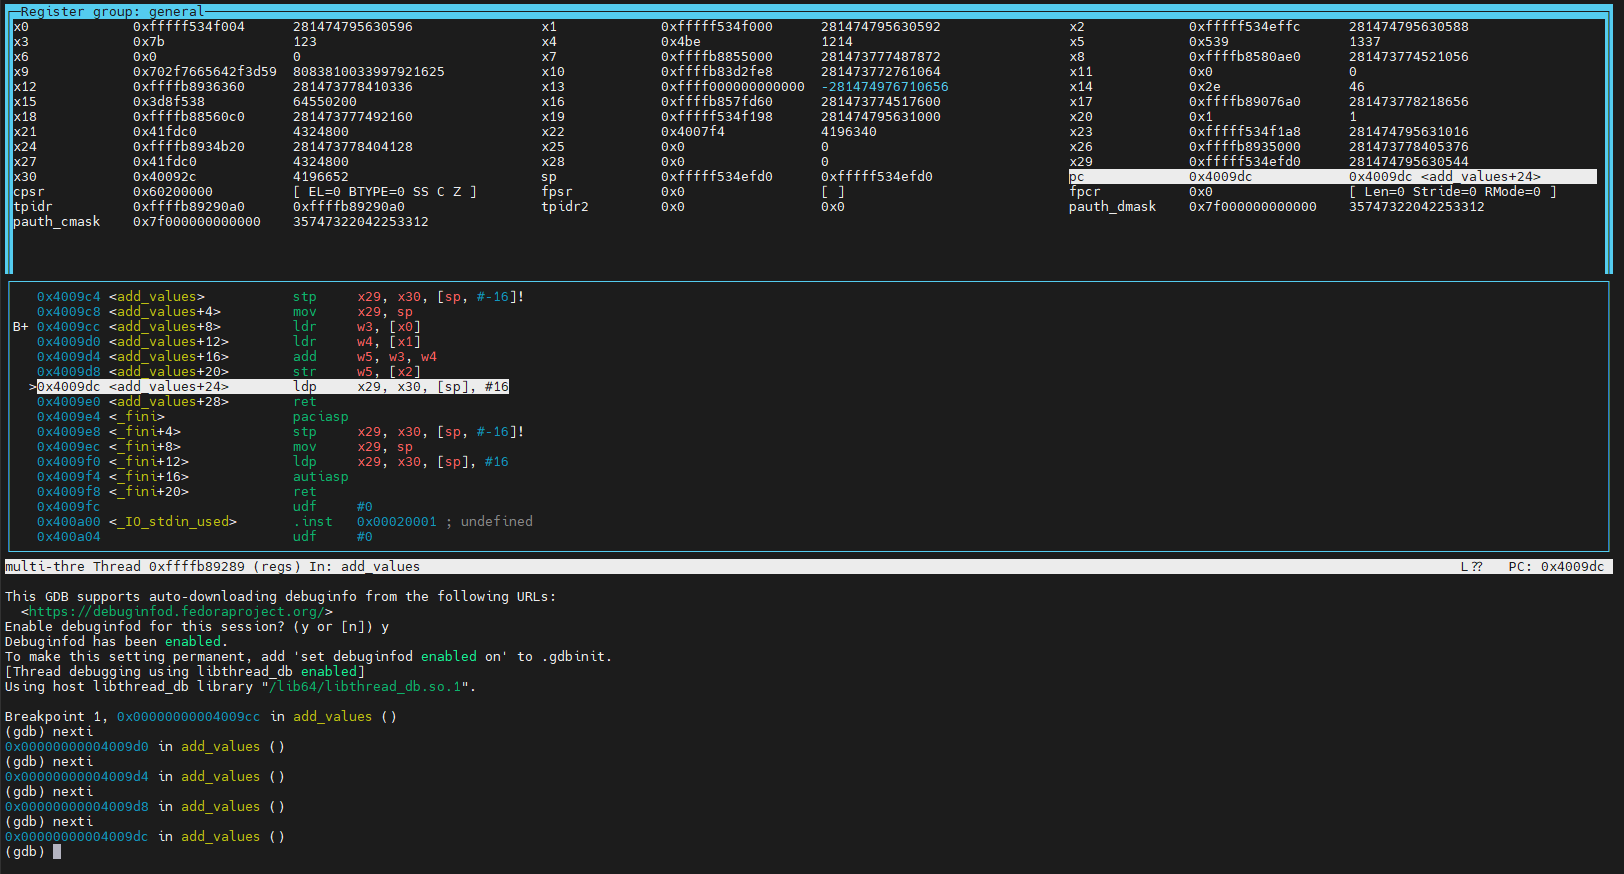
nexti