Base
In this chapter, we get more familiar with some base ARM64 assembly instructions and how to benchmark the performance of such instructions.
All files related to the tasks of this chapter can be found under submissions/base/.
Copying Data
First, we will implement the functionality of the given copy_c_0 and copy_c_1 C functions from the copy_c.c file using only base instructions.
The corresponding assembly code will be written in the copy_asm_0 and copy_asm_1 functions, located in the copy_asm.s file.
1. copy_asm_0
Task: Implement the function copy_asm_0 using only base instructions. The function should have the same functionality as its C counterpart.
    .text
    .type copy_asm_0, %function
    .global copy_asm_0
copy_asm_0:
    ldp w2, w3, [x0]
    stp w2, w3, [x1]

    ldp w4, w5, [x0, #8]
    stp w4, w5, [x1, #8]

    ldp w6, w7, [x0, #16]
    stp w6, w7, [x1, #16]

    ldr w8, [x0, #24]
    str w8, [x1, #24]

    ret
    .size copy_asm_0, (. - copy_asm_0)
2. copy_asm_1
Task: Implement the function copy_asm_1 using only base instructions. The function should have the same functionality as its C counterpart.
    .text
    .type copy_asm_1, %function
    .global copy_asm_1
copy_asm_1:
    mov x3, #0  // counter

start_loop:
    cmp x3, x0  // compare value in x3 and x0
    b.ge end_loop  // conditions: counter x3 greater equal n/x0 (value in [x0])

    ldr w4, [x1, x3, lsl #2]  // address = x1 + (x3 << 2)
    str w4, [x2, x3, lsl #2]  // x3 << 2 = x3 * 4

    add x3, x3, #1
    b start_loop  // unconditional branch

end_loop:
    ret
    .size copy_asm_1, (. - copy_asm_1)
Compile
We compile and run the code using the provided driver:
as copy_asm.s -o copy_asm.ogcc -c copy_c.c -o copy_c.og++ -o copy_driver.exe copy_driver.cpp copy_c.o copy_asm.o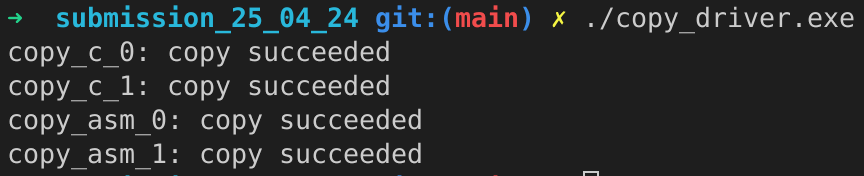
Instruction Throughput and Latency
The next task is to benchmark the execution throughput and latency of the ADD (shifted register) and MUL instructions.
- Files:
benchmark_driver.cppbenchmark.s
For the implementation, we executed the instructions in a loop to achieve a high instruction count, with the goal of accurately measuring
throughput and latency. For the throughput measurement of ADD this looks like this:
    throughput_add:
    // save callee-saved registers
    stp x19, x20, [sp, #-16]!
    stp x21, x22, [sp, #-16]!
    stp x23, x24, [sp, #-16]!
    stp x25, x26, [sp, #-16]!
    stp x27, x28, [sp, #-16]!

    mov X27, #12
    mov X28, #25

loop_throughput_add:
    sub X0, X0, #1 // iteration -= 1

    // execute (25 * rept) add instruction for throughput test
    .rept 100
    add X1, X27, X28
    add X2, X27, X28
    add X3, X27, X28
    add X4, X27, X28
    add X5, X27, X28

    add X6, X27, X28
    add X7, X27, X28
    add X8, X27, X28
    add X9, X27, X28
    add X10, X27, X28

    add X11, X27, X28
    add X12, X27, X28
    add X13, X27, X28
    add X14, X27, X28
    add X15, X27, X28

    add X16, X27, X28
    add X17, X27, X28 // Ignore X18 because its platform register
    add X19, X27, X28
    add X20, X27, X28
    add X21, X27, X28

    add X22, X27, X28
    add X23, X27, X28
    add X24, X27, X28
    add X25, X27, X28
    add X26, X27, X28
    .endr

    // loop back if iteration != 0
    cbnz X0, loop_throughput_add

    // restore callee-saved registers
    ldp x27, x28, [sp], #16
    ldp x25, x26, [sp], #16
    ldp x23, x24, [sp], #16
    ldp x21, x22, [sp], #16
    ldp x19, x20, [sp], #16

    mov X0, #25*100 // set return value to instructions * rept
    ret
    .size throughput_add, (. - throughput_add)
Throughput measurement of MUL is similar. For the latency benchmarking we use read-after-write dependencies to measure the latency of the instructions.
For ADD this looks like this:
.type latency_add, %function
.global latency_add
latency_add:
    mov X1, #25
    mov X2, #45

loop_latency_add:
    sub X0, X0, #1 // iterations -= 1

    // Benchmark the latency using read-after-write using (5 * rept) Instructions
    .rept 5*100
    add X1, X1, X2
    add X1, X1, X2
    add X1, X1, X2
    add X1, X1, X2
    add X1, X1, X2
    .endr

    cbnz X0, loop_latency_add

    mov X0, #5*5*100 // set return value to instructions * rept
    ret
    .size latency_add, (. - latency_add)
And for MUL it is similar again.
Compile: g++ benchmark_driver.cpp benchmark.s -o benchmark.exe
Output:
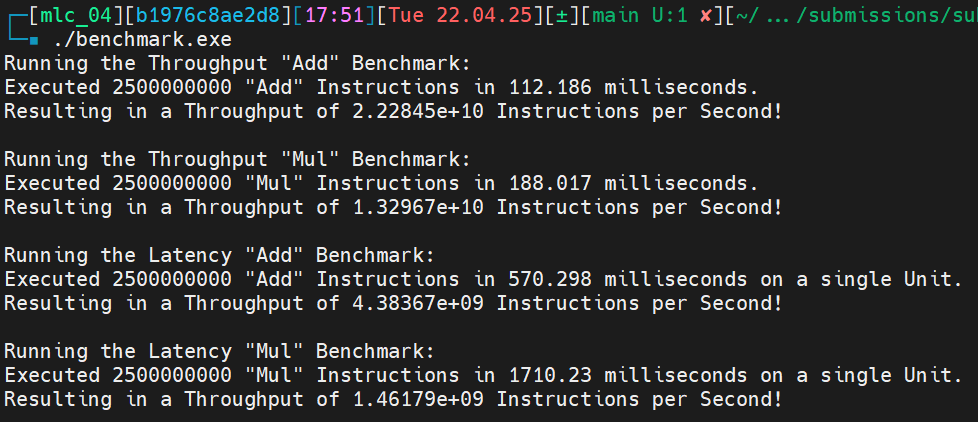
1. Instruction Throughput
Task: Microbenchmark the instruction throughput of ADD (shifted register) and MUL.
The first two blocks of the output shows the throughput benchmarks for ADD and MUL:
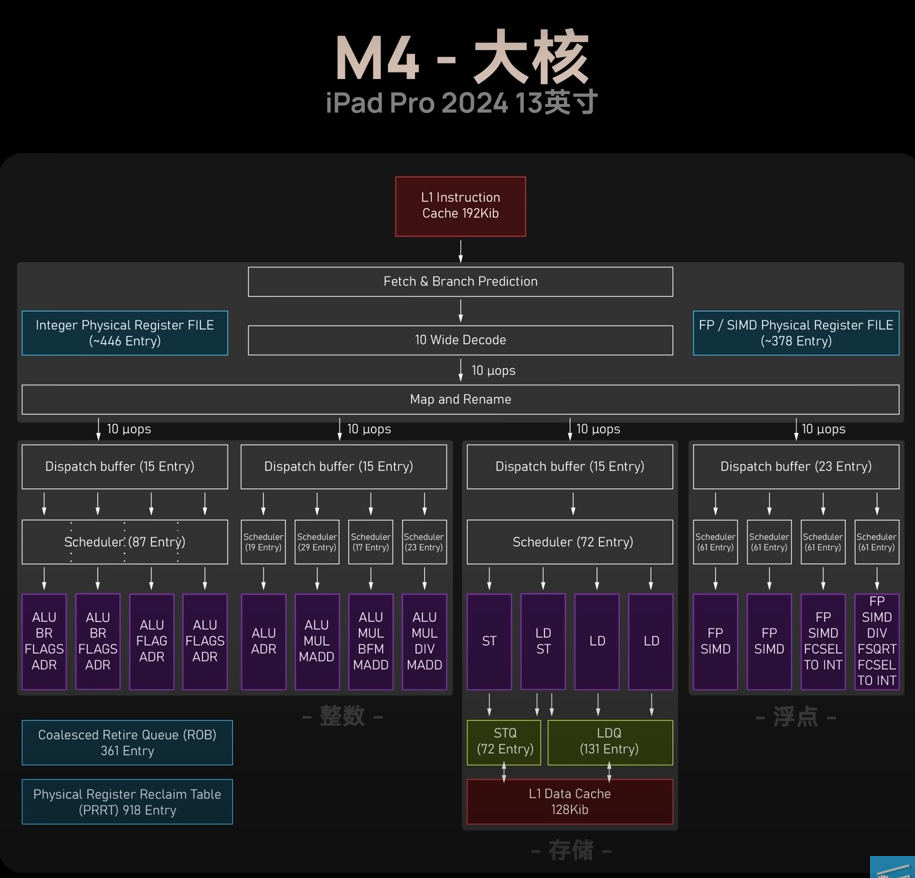
To better understand the throughput, we need to look at the architecture of a M4 performance core.
In the image below, we see that 8 ALU’s of different configurations are present. Since we are using the
ADD and MUL instructions, we have 8 ALU’s that are capable of performing these operations.
ADD:
We have \(22.2845 \cdot 10^9\) instructions per second. That are \(22.2845 \cdot 10^9 / 8 = 2.7856 \cdot 10^9\) instructions per ALU per second.
MUL:
We have \(13.2967 \cdot 10^9\) instruction per second. That resolves to \(13.2967 \cdot 10^9 / 8 = 1.6621 \cdot 10^9\) instructions per ALU per second.
2. Instruction Latency
Task: Microbenchmark the instruction latency of ADD (shifted register) and MUL.
The last two blocks of the output shows the latency benchmarks for ADD and MUL.
Note, that we use read-after-write dependencies to measure the latency, thus we only use a single ALU for measurement.
ADD:
We have \(4.38367 \cdot 10^9\) instruction per seconds in a single ALU. Resulting in a latency of 1 cycle for the known clock speed of 4.4 GHz.
MUL:
We have \(1.46179 \cdot 10^9\) instruction per seconds in a single ALU. Resulting in a latency of \(4.4 \text{ GHz} / 1.46179 \cdot 10^9 \approx 3\) cycles.